Key points:
- Wheat and soybean prices steadied after sharp declines due to improved US crop conditions.
- USDA reported higher than expected good-to-excellent ratings for wheat and soy crops.
- Ample supply and speculative bets on further price falls continue to influence the market.
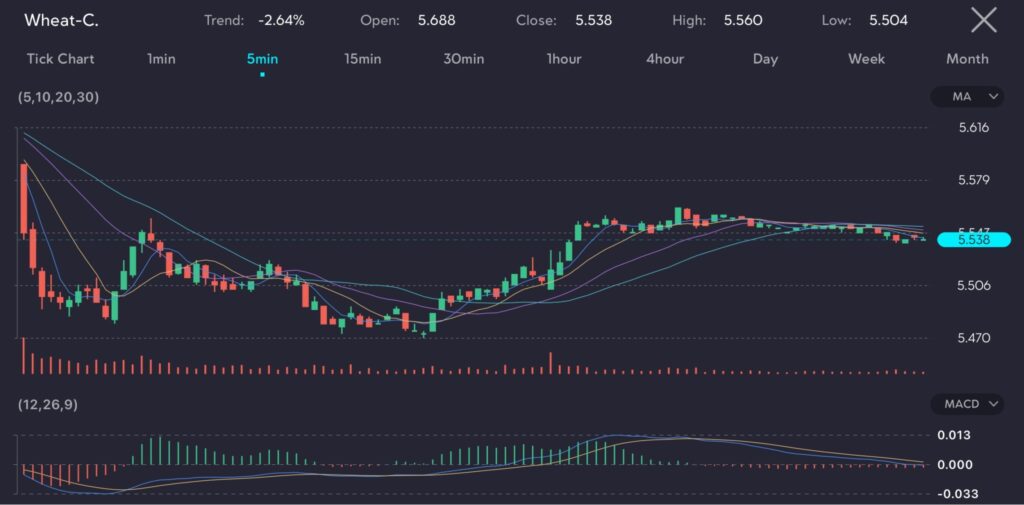
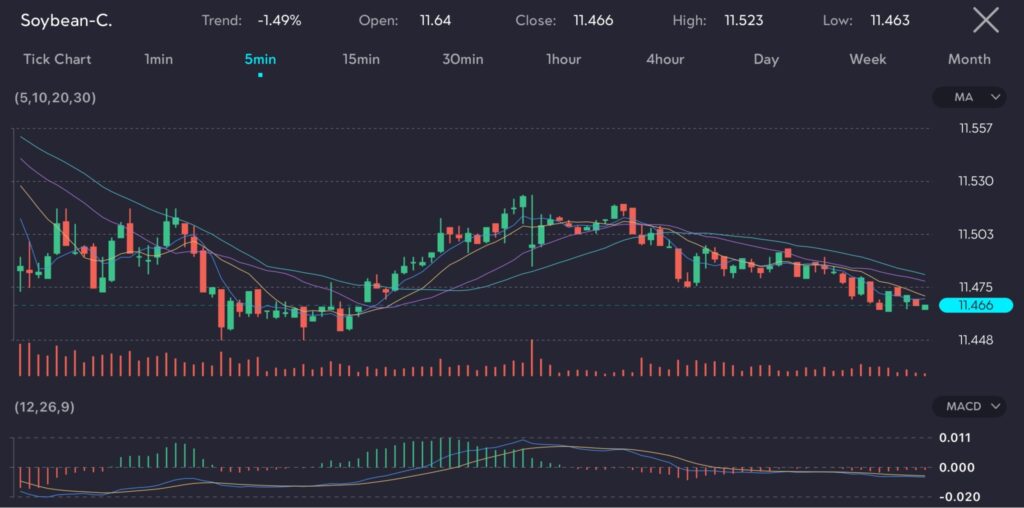
Wheat (Symbol: Wheat-C) and soybean (Symbol: Soybean-C) prices stabilised after significant declines in the previous session, reflecting better-than-expected crop conditions reported by the US Department of Agriculture (USDA).


Images above show wheat and soybean prices stabilising, as observed on the VT Markets app.
Wheat prices rose to $5.54 a bushel after a 3.4% drop. While soybean prices held stable around $11.45-3/4 a bushel, having dropped 2.7% the day before.
The downturn on Monday saw soybean prices falling to the lowest level since 2020, while wheat prices remain around 50 cents above a four-year low hit in March. The sharp declines were primarily following the USDA report on crop conditions.
The USDA report highlight
The latest report of the USDA showed that 68% of soy crops were rated good-to-excellent, the highest rating for this time of year since 2020; and 75% of the wheat crops were rated good-to-excellent, with the wheat harvest 63% complete.
These figures exceeded expectations, signaling robust crop conditions that have eased supply concerns and contributed to the recent price drops.
Related content: What are commodities and how do you trade them
Market outlook and forecast
Given the improved crop conditions, the near-term outlook for wheat and soybean prices suggests further potential for price stabilisation. However, the markets remain sensitive to changes in weather conditions and any unexpected shifts in global supply and demand dynamics.
For commodities day traders, such a stabilisation in prices following the sharp declines offers potential for short-term gains if the prices rebound. However, traders should remain cautious and plan trades with technical analysis while exercising risk management in navigating the volatility in the commodities markets.


