


US stocks surged after Trump froze new tariffs for 90 days. Is this just a dead-cat bounce, or the start of a recovery?
Just two trading days were enough for the S&P 500 to plunge nearly 13%, wiping out weeks of gains and shaking market confidence. The trigger wasn’t earnings or inflation—it was policy. In a surprise move dubbed “Tariff Liberation Day,” President Donald Trump announced sweeping new trade tariffs, including a 104% duty on Chinese electric vehicles and a 10% blanket import tax. While trade pressure had been expected, few foresaw action at this scale or speed.
Then came an abrupt reversal. Just 13 hours later, most of the tariffs were suspended for 90 days. The market rebounded sharply, with the S&P 500 and Nasdaq recapturing lost ground—not out of clarity, but confusion. The rapid policy shift was seen less as strategy and more as a reaction to the selloff. Traders are now questioning whether this was a calculated move or simply a reflex to market stress.
This reaction echoed the so-called “Trump Put”—the idea that Trump softens policies when markets fall too far. It suggests a pattern where market drops trigger recalibrations in policy tone, feeding a cycle where sentiment steers strategy.
Layered into this was a sharp drop in inflation. On 10 April, core CPI rose just 0.1% month-on-month (vs 0.3% forecast), while headline CPI fell 0.1% (vs +0.1% expected). On an annual basis, CPI eased to 2.4% from 2.8%, and core CPI dropped to 2.8% from 3.1%. The data sparked a rally in bonds and sent expectations for a June rate cut soaring—from 72% to 89.5%.
Yet the relief may be short-lived. Most tariffs have not yet taken full effect, and a pricing rebound is possible as businesses adjust preemptively. May and June inflation data could turn higher again. The Fed remains cautious, aware that one soft print does not signal a trend—especially with new trade costs still looming.
Was that the bottom? Possibly, but it hinges on the next 90 days. If the U.S. uses this window to push real trade deals, inflation fears may fade, supporting a more stable recovery. Without that, the market remains vulnerable. The rally back toward 5,500 on the S&P 500 is possible, but fragile. Momentum could easily fade if policy shifts again or inflation rebounds. Traders will need to stay alert for signs of progress—or pressure.
Key Movements of the Week
While macro themes still dominate, traders are refocusing on the charts. Sentiment has bounced, but price action remains mixed. Key assets are nearing inflection points, and how they move from here could shape direction into May.
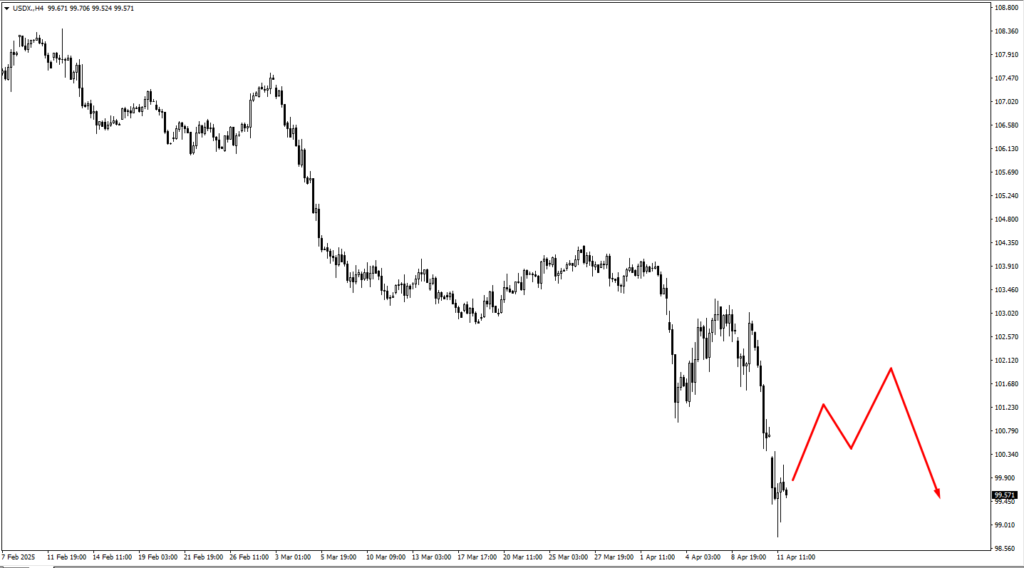
The US Dollar Index (USDX) has paused near 102.40, a level that may act as resistance if the index begins to consolidate downward. Should selling pressure intensify, downside levels near 98.10 or even 97.95 could come into play. This aligns with the broader idea that markets may be re-evaluating the strength of the dollar amid uncertainty over future rate cuts. In this environment, any sustained break below 100 would introduce a weaker dollar narrative, especially if risk assets continue to recover.
The euro is holding its ground. EURUSD is currently eyeing the 1.1210 zone for support. If this fails to hold, the next structure sits lower near 1.1020. Price action here will be critical.
The British pound is approaching a familiar setup. GBPUSD is expected to consolidate near 1.2875. If bullish pressure builds, a new swing high toward 1.3270 becomes a plausible short-term scenario. However, without a fresh catalyst from UK CPI or employment data, this move may face resistance.
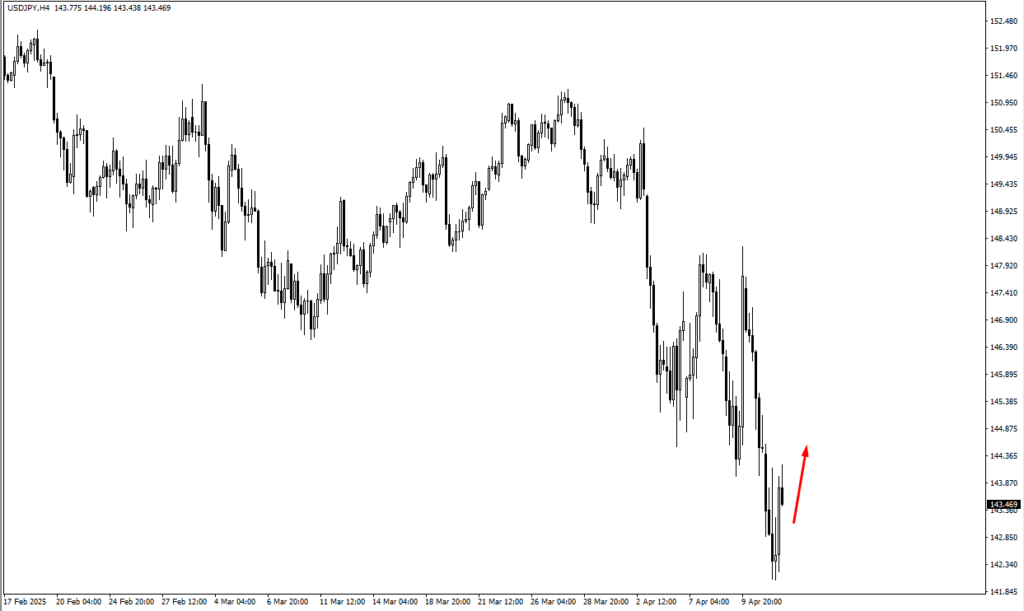
In the yen space, USDJPY has already lifted from the previously monitored 142.10 level. Upside structure now sits at 144.90, followed by a second resistance band near 146.60. But this pair remains a high-beta response to US yields. Any dovish shift from the Fed or bond market softness would likely cap this move and reintroduce downside risk toward 141.
USDCHF is stalling beneath the 0.8410 level. Consolidation here may produce a bearish rejection, especially if global appetite for safe havens increases or Swiss inflation data pressures the SNB into a more hawkish stance.
Commodity-linked currencies are painting their own setups. AUDUSD is targeting the 0.6360 resistance area, though a lack of follow-through may see prices drift back into the 0.6105 to 0.6050 demand zone. NZDUSD mirrors this structure, with resistance near 0.5870 and support in the 0.5680 to 0.5645 region. These ranges remain tight, and direction will likely depend on commodity flows and broader risk sentiment.
USDCAD looks set to pull back toward 1.3760. This zone could provide support if oil prices stabilise. However, the broader view still tilts bearish unless the pair reclaims the 1.4050 resistance zone with conviction.
Speaking of oil, USOIL has been climbing and could revisit the 66.10 level. But if trade tensions resurface, downside targets as low as 53.00 cannot be ruled out. The commodity remains tightly linked to political risk and speculative flows, making near-term predictions volatile.
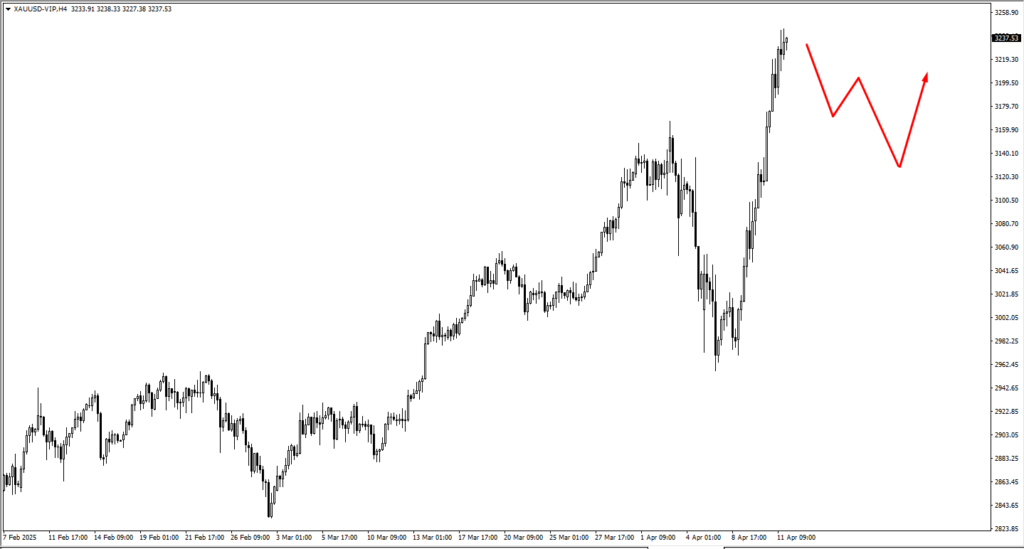
Gold is trading just above the 3,215 zone. Price may now consolidate before attempting another push higher. Should momentum persist, the next structural zone to monitor is 3,300. However, a failure to break this level cleanly could trigger a pullback to 3,130.
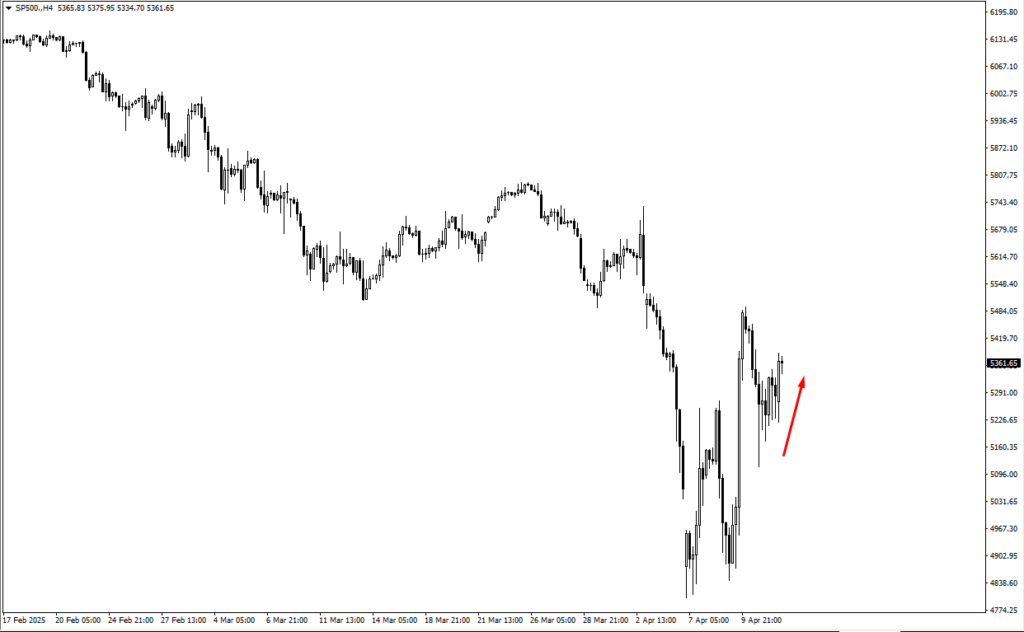
The S&P 500 has bounced above the 5,091 level following the tariff-induced drop. The rally could extend toward 5,610, but this hinges on follow-through and broader economic stabilisation. Equity bulls may get their test this week as earnings season continues and policymakers weigh in on trade.
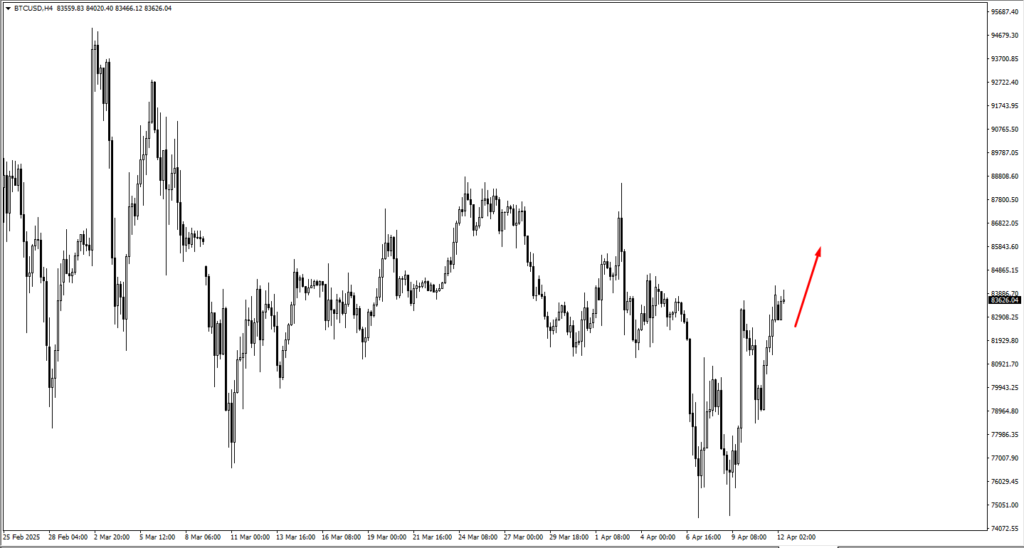
Bitcoin has continued its climb, now targeting the 85,850 level. Momentum remains on the bulls’ side for now, but the rally looks extended. Any pause near this level could invite a correction, especially if broader risk sentiment wavers.
Natural gas continues to drift lower. Price is nearing the 3.305 low, and failure to hold this zone could invite another wave of selling.
As traders digest recent volatility, these chart structures are emerging as the key battlegrounds. Momentum is resetting, but conviction remains light. Without clear catalysts, the market may trade defensively, focused more on risk control than breakout conviction. The days ahead will test whether this rebound has structural support—or if it’s merely a pause before the next move.
Key Economic Events This Week
After a volatile week driven by tariffs and a sharp drop in US inflation, traders now turn to scheduled economic data for direction. Monday opens quiet, but activity builds quickly.
Tuesday brings Canada’s Trimmed CPI y/y, forecast at 2.90%. A steady reading could support the Canadian dollar, with USDCAD expected to consolidate upward.
Wednesday sees UK CPI expected to ease to 2.70% from 2.80%. A softer print may pressure the pound, aligning with the broader GBPUSD consolidation. Canada’s overnight rate is forecast to hold at 2.75%, likely reinforcing the bullish lean in USDCAD if tone remains neutral.
Thursday is the key event day. Fed Chair Powell’s speech could reshape rate expectations after last week’s CPI surprise. New Zealand CPI is forecast to rise to 0.70% q/q, which may fuel NZD strength if confirmed. The European Central Bank is expected to cut its Main Refinancing Rate to 2.40%, which could weigh on the euro if accompanied by dovish language.
There are no major releases scheduled for Friday, offering markets a brief window to consolidate after what may be a volatile midweek. With traders now hyper-sensitive to inflation shifts and central bank tone, each print and comment carries added weight.
Price action across key pairs and indices remains reactive rather than proactive—waiting for the next clue, the next release, or the next word from policymakers to tip the balance.


