Market Focus
Stocks extended declines Friday to close a second straight week in negative territory with geopolitical tensions intensifying to contribute to a further risk-off tone in markets. Dow Jones closed down 0.68% to 34,079.12 after erasing 1.8% Thursday for its worst day in nearly three months, and it also closed at its lowest level since September. The Nasdaq Composite shed 1.23% to 13,548.07 — its lowest level since January. Meanwhile, the CBOE Volatility Index (VIX), or “fear gauge,” spiked back to hover near January 28th highs.

Just 7 weeks ago, Zhenro Properties Group Ltd had announced plans to redeem a perpetual bond and claimed that one of its units had secured a 9.14 billion yuan ($1.44 billion) credit line from state-owned Bank of China Ltd. Zhenro’s short-dated bonds were trading near 80 cents on the dollar, compared with 17 cents for embattled property giant China Evergrande Group.
Now Zhenro has become the latest developer to warn it may not meet its obligations, an U-turn that’s extreme even by the standards of an industry where negative surprises have multiplied over the past year.
The company’s sudden and mysterious slide into distress is raising investors’ concerns toward many of its peers, overshadowing efforts by the Chinese government to curb financial contagion in a real estate sector that generates nearly 30% of economic output. Speculation about a piotential default at Zhenro helped spark a broad slump in Chinese developer bonds last week, driving up financing costs for companies that need to repay almost $100 billion of debt this year.

Main Pairs Movement:
The dollar traded within tight ranges versus major currencies as a holiday-muted week got underway in the Asia-Pacific on Monday, with little sign of risk-off sentiment amid geopolitical tensions over Ukraine. The greenback trades at familiar levels with most of its major peers, while the Aussie was quoted lower, following a local naval spat with China.
EUR/USD opened Monday at 1.1315, around 4 pips lower than its Friday close but soon bounced back to around 1.1320. GBP/USD started the week with a 10-pip rally in the first hour, trading at 1.3591 as of writing. AUD/USD eases 0.2% to 0.7164; pair finished last week 0.6% higher for its third weekly advance. USD/JPY falls 0.1% to 114.92 after finishing last week 0.4% lower
Gold surged a significant $7 per troy ounce in few minutes after its open due to the rising military conflict possibility between Ukraine and Russia. Crude oil prices as well surged strongly, with WTI traded at $92.60 a barrel, up 0.65% than Friday’s close, and Brent at $94.80 a barrel, up 1.24%.
EURUSD (4-Hour Chart)

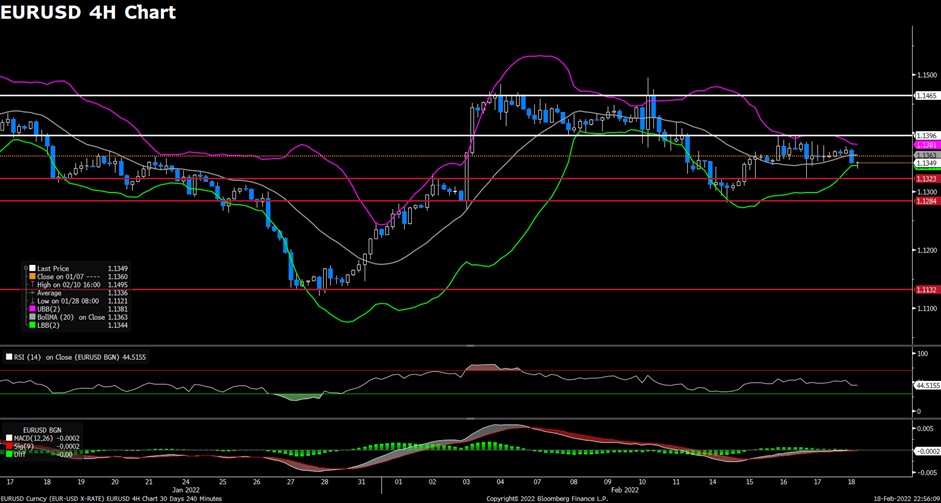
The EUR/USD pair declined on Friday, retreating to 1.1350 area amid the mixed headlines surrounding the tensions between Russia and Ukraine. The pair flirted with 1.1365~1.1375 area during first half of the day, then started to see fresh selling after European session started and dropped to a daily low near 1.1340 mark. The pair is now trading at 1.1349, posting a 0.08% loss on a daily basis. EUR/USD stays in the negative territory amid risk-off market mood, as Russia claimed Ukraine for committing war crimes in Donbas meanwhile US Secretary of State told the UN Security Council that Russia was using it as an excuse to start an attack on Ukraine. But the falling US Treasury bond yields should cap the upside for the greenback. For the Euro, hawkish comments from ECB policymaker Peter Kazimir should limit the losses for EUR/USD pair, as he supported an axing of QE in August and immediate rate hike thereafter.
For technical aspect, RSI indicator 43 figures as of writing, suggesting bear movement ahead. As for the Bollinger Bands, the price is now hovering around the lower band, which indicates that the downside traction should persist. In conclusion, we think market will be slightly bearish as the pair is heading to test the 1.1323 support. The pair could extend its slide toward 1.1300 below that level.
Resistance: 1.1396, 1.1465
Support: 1.1323, 1.1284, 1.1132
GBPUSD (4-Hour Chart)

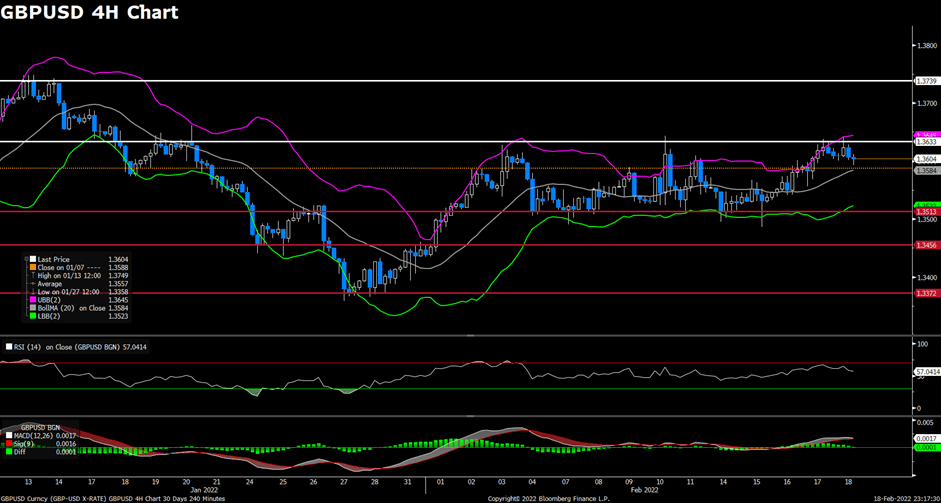
The pair GBP/USD edged lower on Friday, lacking bullish strength after supporting by upbeat UK Retail Sales data in early European session. The pair climbed higher to a one-week high above 1.3640 mark, but failed to preserve its upside momentum and dropped towards 1.3600 level during American session. At the time of writing, the cable stays in negative territory with a 0.08% loss for the day, rebounding slightly from a daily low. The stronger US dollar weighed on the cable as safe-haven flows dominated the financial markets today, meanwhile investors keep digesting the latest developments surrounding the Russia-Ukraine conflict. For British pound, the stronger-than-expected UK January Retail Sales showed sales were up 1.9% in January, which surpassed market expectations of 1.0% and lend some support to the GBP/USD pair.
For technical aspect, RSI indicator 57 figures as of writing, suggesting that upside is more favored as the RSI stays above the mid-line. But for the Bollinger Bands, the price is now dropping towards the moving average, indicating a continuation of bearish trend. In conclusion, we think market will be bearish as long as the 1.3633 resistance line holds. the pair already broke above the previous resistance at 1.3612, the pair will need to rise above that level and starts using it as support for some short-term gains.
Resistance: 1.3633, 1.3739
Support: 1.3513, 1.3456, 1.3372
USDCAD (4-Hour Chart)

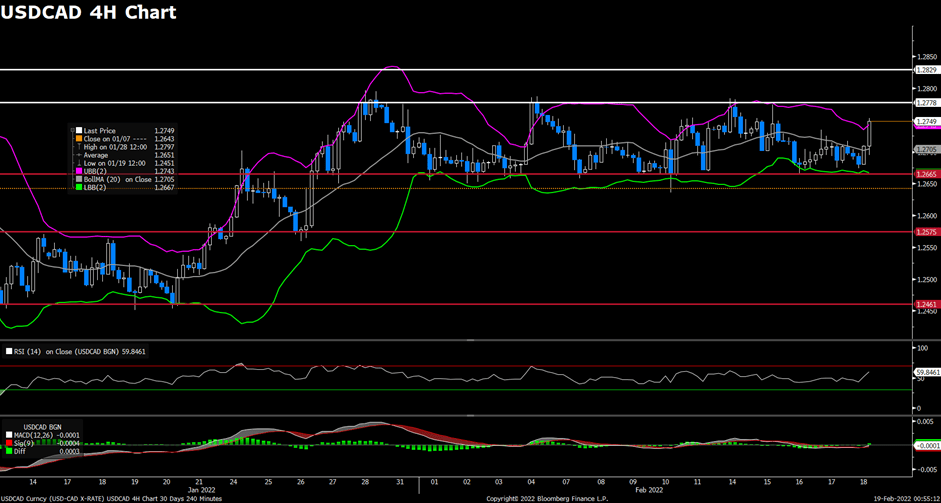
As the safe-haven flows dominated the financial market on Friday, the pair USD/CAD witnessed some some dip-buying and capitalize on renewed US dollar strength. The pair dropped to a daily low near 1.2675 mark during European session, then staged a goodish rebound to recover most of its daily losses. USD/CAD is trading at 1.2749 at the time of writing, rising 0.32% on a daily basis. Signs of escalating fighting in Easter Ukraine and FOMC member Charles Evan’s comment both lifted the pair higher, he said that Fed could do a substantial repositioning of its policy to deal with high inflation. On top of that, falling crude oil prices also weighed on the commodity-linked loonie and acting as a tailwind for USD/CAD, as hope for a diplomatic solution to Ukraine conflict and an agreement for the Iran/US deal both add pressure on the black gold.
For technical aspect, RSI indicator 59 figures as of writing, suggesting that upside is preserving strength as the RSI is approaching 60. As for the Bollinger Bands, the price is now moving out of the upper band, which showed that a strong trend continuation could be expected. In conclusion, we think market will be bullish as the pair bounces from three-week-old support and heads to test the 1.2778 resistance.
Resistance: 1.2778, 1.2829
Support: 1.2665, 1.2575, 1.2461
Economic Data:
| Currency | Data | Time (GMT + 8) | Forecast |
| EUR | German Manufacturing PMI (Feb) | 16:30 | 59.5 |
| GBP | Composite PMI | 17:30 | |
| GBP | Manufacturing PMI (Feb) | 17:30 | |
| GBP | Services PMI | 17:30 | |
| CNY | PBoC Loan Prime Rate | 21:15 |