

Key points
- South Korean won hits a two-week low
- Indonesian rupiah snaps an eight-day rally
- Philippine stocks reach over a two-month high
The prospect of Trump returning to the White House after the attack has intensified worries. His hawkish trade policies, loose regulations, fiscal plans, and potential tax cuts could fuel inflation and delay rate cuts.
The dollar index (DXY) last traded at 104.210 against a basket of major currencies. Despite the holiday in Japan halting cash U.S. Treasuries trading, the 10-year Treasury futures trended lower.
South Korean won hits three-week low
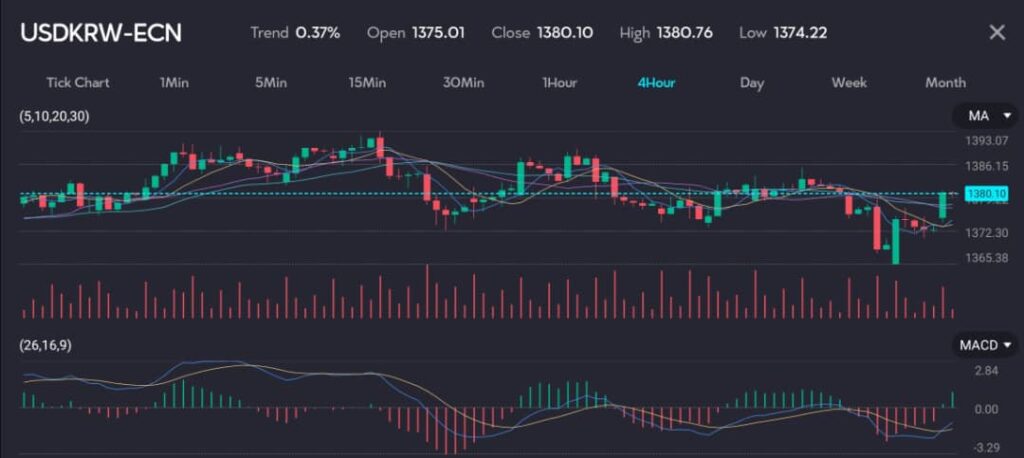
Picture: South Korean won under pressure as recorded on the VT Markets app.
The South Korean won (USDKRW) fell by as much as 0.6% to 1,383.40, its lowest since early July. The Thai baht (USDTHB) and the Philippine peso (USDPHP) each lost about 0.3%.
The Indonesian rupiah (USDIDR) also declined by 0.3% after an eight-day rally until last Friday, ahead of the central bank’s monetary policy meeting set for Wednesday.

See: Rupiah declines against dollar as seen on the VT Markets app.
The weakness in the rupiah followed its strong performance in June amid concerns of potential fiscal slippage under the Prabowo administration. Bank Indonesia (BI) is widely expected to hold interest rates at 6.25% at this week’s meeting but might cut by 25 basis points next quarter.
BI aims to ensure the rupiah can recover or stay stable and is likely to wait for the U.S. Federal Reserve to act before making any moves.
Mixed performance for emerging Asian equities
Equities in emerging Asian countries showed mixed results. Shares in Malaysia (BURSA) were up 0.4%, while those in Taiwan (TWSE: TAIEX) and Thailand (SET) were down roughly half a percentage point.
The Philippine benchmark index (PSEI) rose as much as 1%, trading around its highest level since early May.
China’s slower-than-expected growth raises stimulus hopes
China, the region’s biggest trading partner, reported second-quarter economic growth much slower than expected, keeping alive expectations that Beijing will need to inject even more stimulus to boost growth.
The Chinese yuan (USDCNY) slipped off a one-month high against the dollar touched in the prior session, while the Shanghai Composite index (000001) traded slightly higher.
Asian currencies and markets remain under pressure as political and economic uncertainties persist. Investors should stay vigilant and monitor upcoming policy decisions and economic data for better market navigation.
Start trading now — click here to create your live VT Markets account.


