


Key Points:
- CL-OIL (WTI crude oil) futures trade around $69.80 per barrel, nearing a four-week high.
- US tariffs on Venezuelan crude and falling US stockpiles boost sentiment.
- OPEC+ production increases loom in April, while US sanctions intensify supply risks as WTI poised for third consecutive weekly gain.
WTI Crude Oil Prices Approach Four-Week High
WTI crude oil futures hovered around $69.80 per barrel on Friday, edging closer to the four-week high of $70.03, supported by tightening global supply and ongoing concerns about potential disruptions. As of the latest data, WTI is nearing $69.84, holding steady in a market bracing for potential supply chain disruptions.
US Tariffs Heighten Risk of Supply Disruptions
Earlier in the week, the US threatened to impose a 25% tariff on nations purchasing Venezuelan crude, a move that would disrupt trade flows, particularly to China.
This sparked market reactions, with Reliance Industries, India’s largest refiner, announcing it would halt Venezuelan oil imports.
Strong US Crude Demand Amid Falling Stockpiles
US crude stockpiles showed a 3.34 million barrel drop in the latest data, more than twice the expected decrease, pointing to strong demand. With inventory levels dropping, market sentiment remains bullish as traders watch for more data on oil consumption and supply.
OPEC+ to Resume Production Increases in April
OPEC+ has signaled its intention to revive previously idled production in April, contributing to market uncertainty. Expectations for a rise in Russian oil output further compound concerns about oversupply, potentially applying downward pressure on WTI prices in the medium term.
Technical Analysis
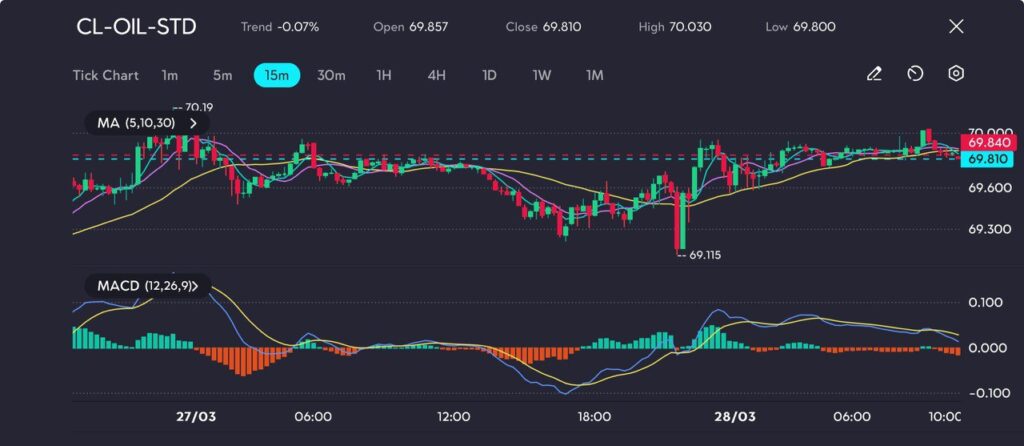
Picture: CL-OIL consolidates near $69.80, testing resistance at $70.00, as seen on the VT Markets app.
CL-OIL decreased by 0.07%, closing at $69.81 after opening at $69.86. The session saw a slight retracement from a high of $70.03 to close just above the key support level at $69.80.
The moving averages (MA 5,10,30) show consolidation, with short-term MAs flat and slightly below the longer-term averages. This suggests that the bullish momentum is losing steam and the price is entering a range-bound phase. The MACD (12,26,9) is also signaling weakening momentum, with the histogram narrowing, and the MACD line (blue) moving closer to the signal line (yellow), suggesting a potential shift towards neutrality.
Key levels to monitor include $69.80 as immediate support and $70.00 as resistance. A break above resistance could confirm further upside potential, while a drop below support could signal a bearish reversal.


