Key Points:
- Gold (XAUUSD) prices hover around $3,116 per ounce.
- Bullion surged 19% in the first quarter of 2025.
- Markets await President Trump’s tariff announcement as gold’s powerful rally continues amid tariff uncertainty.
Gold Prices Hover Near $3,116 as Markets Await Trump’s Tariff Decision
Gold (XAUUSD) prices eased slightly on Wednesday morning, trading near $3,116 per ounce, as the deadline for President Donald Trump’s reciprocal tariffs approached. Market participants are anxiously awaiting the president’s announcement on tariffs, which could have significant implications for global trade.
Gold traders, in particular, are defensive as they prepare for the potential impact of tariffs, including speculation over whether gold itself will be subject to them.
Gold’s Historic Rally Continues Amid Uncertainty
The precious metal has seen a meteoric rise in the first quarter of 2025, surging by 19%. This is reminiscent of the last major rally in gold prices, which occurred in 1986. With central banks, investment funds, pension funds, and retail traders all buying up bullion, gold reached an all-time high of $3,148.97 per ounce.
The surge comes at a time when traders are flocking to safe-haven assets, driven by concerns about the global economy and trade tensions. On April 1, gold hit a new high of $3,150, marking its 18th record high of 2025. However, the price quickly reversed, and by early Wednesday, it had settled near $3,116 per ounce.
Technical Analysis and Market Outlook

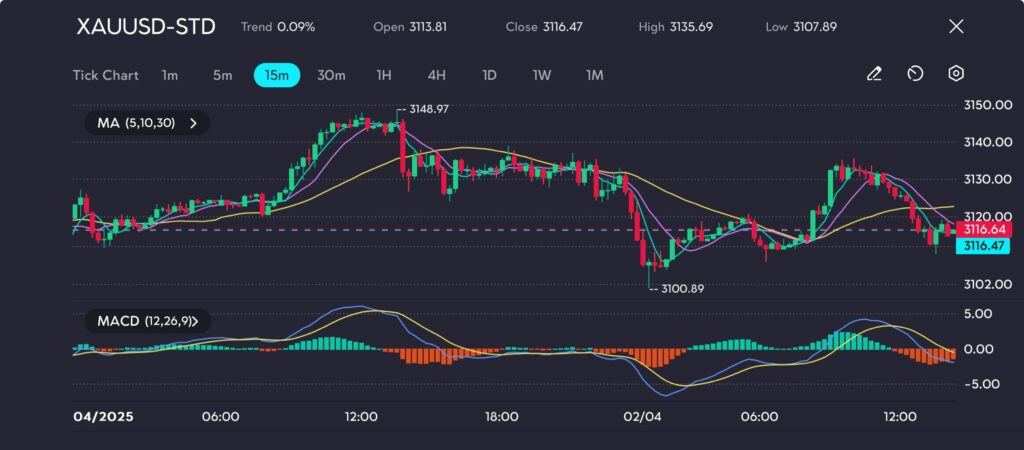
Picture: XAUUSD tests resistance at 3135.69 after recent rally from 3100.89, as seen on the VT Markets app.
XAUUSD increased by 0.09%, closing at 3116.47 after opening at 3113.81. The session saw a high of 3135.69 before retracing, settling slightly below the session’s high.
The moving averages (MA 5,10,30) suggest a continuation of bullish momentum, with the short-term MAs above the longer-term averages, indicating an overall positive price trend. However, the MACD (12,26,9) is starting to show signs of weakening momentum, as the histogram shrinks, and the MACD line (blue) approaches the signal line (yellow). This could indicate a potential consolidation or short-term reversal.
Key levels to monitor include 3135.69 as resistance and 3100.89 as support. A break above the resistance may lead to further upside, while a move below support could signal a bearish retracement or downward momentum.
The market remains on edge, with traders awaiting President Trump’s tariff update, which could influence the direction of gold in the coming days.


