

Key points:
- Nikkei falls 1.11% to a one-month low of 39,154.85, marking the longest losing streak since October 2021.
- Yen rallies to a seven-week high of 154.36 per dollar, impacting exporter shares.
Japan’s Nikkei share average dropped for a sixth consecutive session on Wednesday, closing at a one-month low of 39,154.85, down 1.11%. This marked its longest losing streak since October 2021. The broader Topix index also slid 1.42% to 2,793.12.
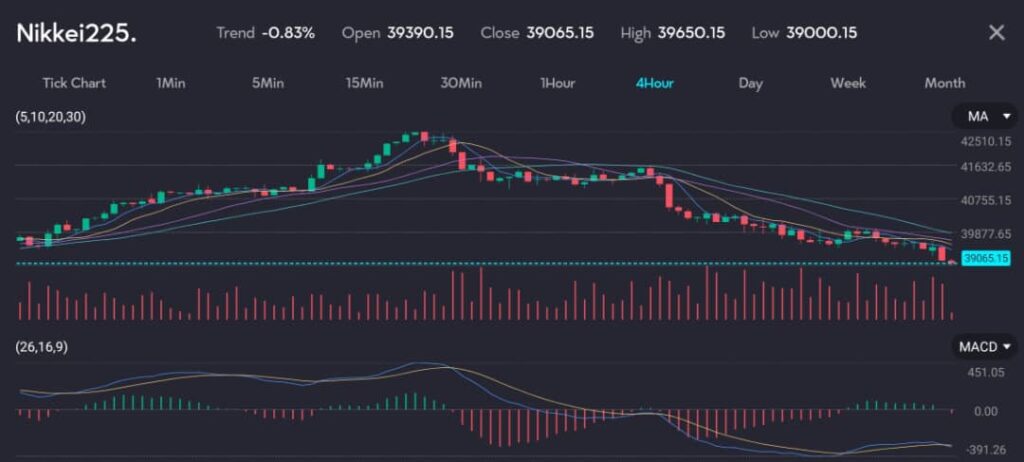
See: Nikkei225 sees a decline on the VT Markets app.
Mixed US tech earnings and strong yen impact Nikkei decline
The decline was driven by mixed earnings reports from major U.S. tech firms and a strengthening yen. Wall Street had ended slightly lower on Tuesday as investors awaited earnings from Alphabet and Tesla.
Alphabet exceeded second-quarter earnings estimates, but Tesla reported its lowest profit margin in over five years and missed estimates, contributing to market uncertainty.
Yen’s rally to seven-week high adds pressure on exporter shares
The yen’s rally to a seven-week high of 154.36 per dollar on Wednesday, reflecting a 56% chance of a rate hike at the Bank of Japan’s upcoming monetary policy meeting, added pressure. A stronger yen typically hurts exporter shares as it reduces the value of overseas profits when converted back to yen.
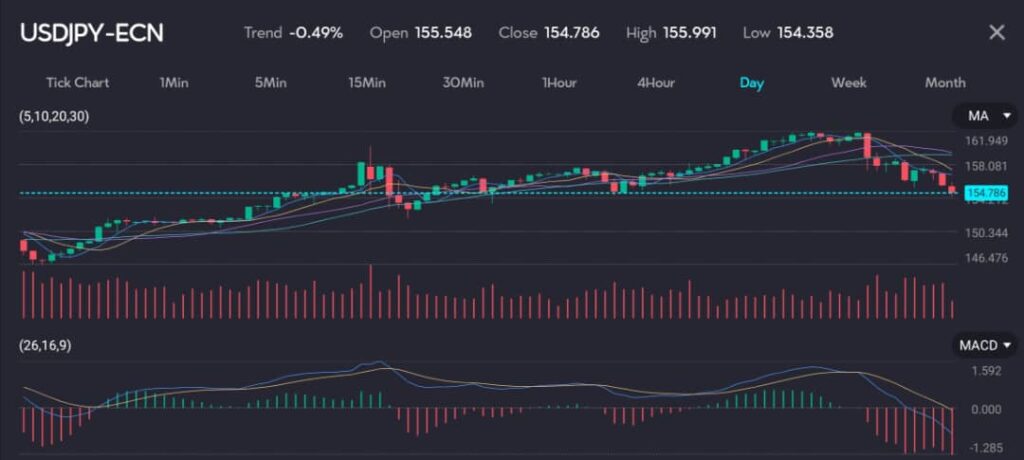
See: Yen on the rise, trading at 154.784 as seen on the VT Markets app.
Traders might stay cautious about testing the limits of yen weakness even if the Bank of Japan does not adopt a hawkish stance next week. This scenario could pose further challenges for Japanese equities, especially if Big Tech earnings fail to meet expectations.
Upcoming Fed meeting and Japan’s earnings season impact major stocks
The U.S. Federal Reserve is also set to meet next week, coinciding with Japan’s earnings season entering full swing. Among individual stocks, Uniqlo parent Fast Retailing fell 0.8%, Tokyo Electron, a chip-making equipment giant, declined 0.9%, and silicon wafer maker Shin-Etsu Chemical dropped 2.3%, making them the biggest drags on the Nikkei.
Also read: Nikkei rebounds as chipmakers and shippers lead rally
The benchmark index had hit a record high of 42,426.77 on July 11 but has since experienced losses as chip shares underperformed and the yen appreciated sharply from the 161 range.
Start trading now — click here to create your live VT Markets account.


