


Key Points
- WTI (CL-OIL-ECN) closes at $59.48, down 1.16%, after hitting an intraday high of $63.32.
- Brent crude set to fall 4% this week, with WTI tracking a 3.8% weekly loss—both benchmarks down over 11% last week.
- U.S. Energy Information Administration lowers global growth and oil demand forecasts.
Crude oil prices resumed their slide on Friday, setting up a second consecutive week of losses as escalating tensions between the U.S. and China reignited concerns about a global economic slowdown and shrinking crude consumption.
The benchmark West Texas Intermediate (WTI) fell 0.6% to $59.71, while Brent crude dropped 0.5% to $63.02. The downward trend follows a bruising Thursday session where both contracts lost over $2 per barrel, continuing a broader 11% selloff from the prior week.
Demand Destruction in Focus as Growth Slows
A growing chorus of warnings from analysts and policymakers paints a stark outlook. ANZ’s Daniel Hynes warned that global oil consumption could fall by 1% if GDP growth drops below 3%, a threshold that is increasingly under threat amid widespread tariff retaliation. The U.S. Energy Information Administration (EIA) echoed this concern, cutting both global and U.S. oil demand forecasts for this year and the next in response to deteriorating macroeconomic indicators.
President Trump’s move to raise tariffs on Chinese imports to 145%, despite a pause on other partners’ duties, adds to the pessimism. China has responded with an 84% tariff on U.S. goods, intensifying the trade standoff between the world’s two largest oil consumers. With trade volumes shrinking and supply chains disrupted, oil traders are quickly recalibrating for a scenario in which demand erosion outweighs supply risks.
Technical and Market Outlook
The WTI chart (CL-OIL-ECN) highlights a sharp retracement after a rally that peaked at $63.32, now giving way to sustained selling pressure. The MACD (12,26,9) has clearly crossed into negative territory, while the price has dropped below the key moving averages (5, 10, 30), confirming a bearish structure. The low of $55.12 from the previous day still looms as a possible near-term support if current weakness continues.
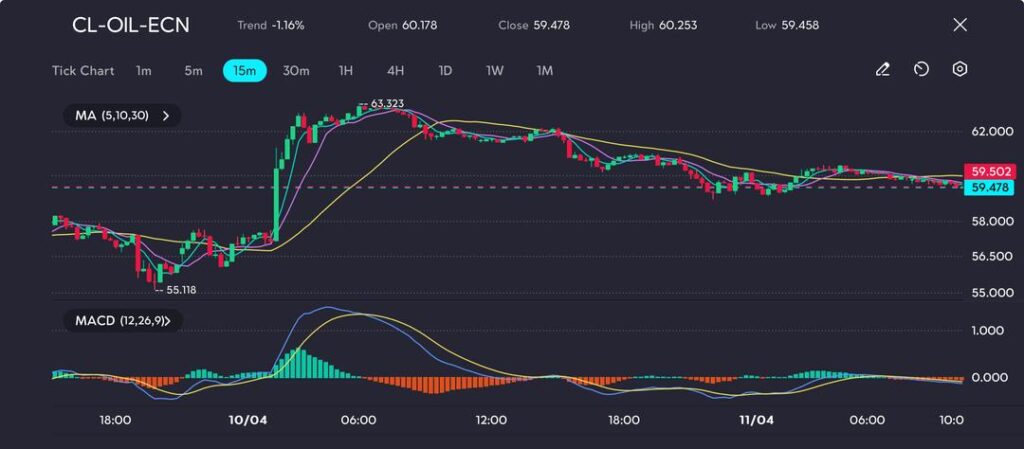
Picture: Crude pulls back from session highs, eyeing support at $59. MACD shows momentum is fading fast, as seen on the VT Markets app
The technical rejection at $63.32 caps the recent bullish attempt, while the current trading zone near $59.48 suggests a potential retest of the $58–$55 support band. The MACD histogram remains negative, indicating that momentum is still bearish, with no strong signs of reversal just yet.
The market will now look to next week’s OPEC+ commentary, Chinese industrial output data, and updates from U.S. refiners to determine if the pullback deepens or stabilises. Unless macro conditions shift dramatically, crude may struggle to find sustained upward momentum in the near term.


