Key points:
- The S&P 500 surged over 1%, marking its best performance since June 5.
- Nvidia led the tech rebound with a 4.8% gain.
- Market gains followed President Joe Biden’s announcement to not seek re-election.
This article is a follow up to: Nasdaq and S&P 500 hit new highs as jobs data spurs rate cut hopes
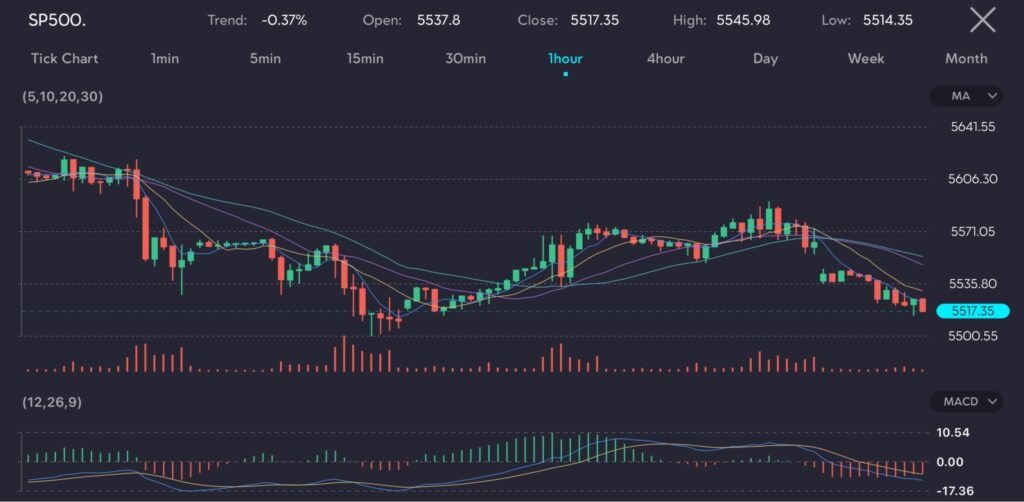
The S&P 500 (Symbol: SP500) rallied more than 1%. closing at 5,564.41 and marking its best single-day performance since June 5. This robust recovery follows a challenging week for stocks, particularly in the tech sector, which suffered a major setback due to a major tech outage on Friday.

Picture: S&P 500 rebounds as tech shares lead market recovery, as observed on the VT Markets app.
Tech giants leading the rebound
Leading the charge were mainstay tech companies, with chip giant Nvidia (Symbol: NVIDIA) surging 4.8%.
The boost in market sentiment came on the heels of President Joe Biden’s unexpected announcement on Sunday that he would not seek re-election. This development has introduced renewed volatility as traders speculate on who will emerge as the Democratic nominee.
The uncertainty regarding the political landscape has reinvigorated market fluctuations, especially considering the previous market pricing for a Biden vs. Trump scenario.
Along the S&P500, the Nasdaq Composite (Symbol: NAS100) also outperformed, rising 1.6%, driven by strong buying momentum in the tech sector.
The Dow Jones Industrial Average (Symbol: DJ30) saw a more modest increase of 0.3%, with fewer appealing stocks to capture investor interest.
Learn how to trade indices such as the S&P500, the Nasdaq Composite and the Dow Jones Industrial Average.
Market outlook hinting caution
For short-term traders, the recent rebound in the S&P 500 and the tech sector’s strong performance suggest potential opportunities for quick gains.
However, the political uncertainty following President Biden’s announcement may introduce volatility, requiring traders to remain vigilant.


