


Key Points
- U.S. 10-year note yields rose to 4.45%, their biggest weekly jump in 24 years.
- The USNote10Y chart shows a decline to 110.28, after a peak of 111.27.
- Global markets retreat as traders abandon U.S. assets for gold, the Swiss franc, and euro.
The rout in the U.S. Treasury market deepened on Friday, capping off a historic week where the 10-year yield soared 45 basis points to 4.45%, the sharpest weekly rise since 2001. This violent bond market reaction reflects a deep loss of trader confidence in U.S. fiscal stability, worsened by the White House’s erratic tariff escalation and mounting fears of a deep global recession.
This week’s price action is not driven by inflation fears alone. Instead, the exodus from Treasuries appears to be fuelled by growing worries that escalating trade tensions, a deteriorating fiscal position, and a weakening dollar could all converge into a broader macro crisis. Michael Krautzberger, Global CIO for Fixed Income at Allianz, said the selloff may also reflect fears that a recession would expose the already strained U.S. budget outlook.
Even 30-year bonds have not been spared, with yields spiking to 4.90%—marking the largest weekly move since 1982, according to LSEG data.
The Federal Reserve, meanwhile, appears reluctant to ease policy quickly. Despite soft U.S. CPI data showing a surprise decline in March, FOMC minutes indicated concerns about the inflationary impact of new tariffs, leaving rate cuts off the table in the near term. This stance has further eroded confidence in Treasuries as a hedge.
Global Traders Rotate Out
Safe-haven demand has shifted elsewhere. The Swiss franc has hit a 10-year high, the yen is at a six-month peak, and gold has soared to $3,210/oz, setting a new record. Meanwhile, the dollar index (USDX) broke below 100, losing ground across the board and underscoring the shift away from U.S. assets.
The Treasury market, once seen as the ultimate safe harbour, now finds itself at the centre of a global selloff. Institutional traders are believed to be rebalancing away from U.S. debt, while leveraged funds unwind positions to de-risk portfolios.
Technical Outlook and Cautious Forecast
The 10-Year US Treasury Note shows signs of consolidation after failing to reclaim the recent high at 111.27. The chart reveals a gradual downtrend from that peak, with lower highs and lower lows forming consistently into the morning of April 11. Price touched a session low of 110.03, which aligned with the 110.00 psychological level and triggered a minor bounce.
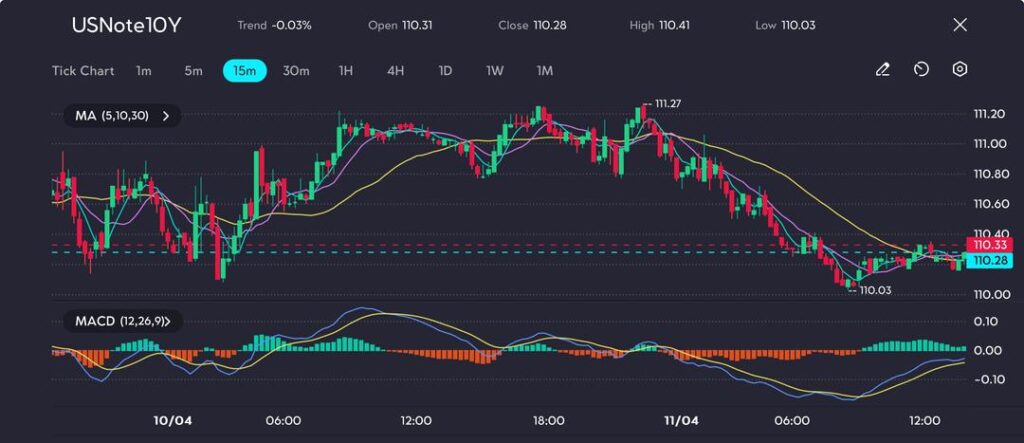
Picture: 10Y note hovers in a holding pattern after testing key support at 110.03, seen on the VT Markets app
The MACD histogram had been firmly negative throughout the slide but is now flattening with a potential bullish crossover forming—hinting at short-term exhaustion in selling pressure. However, price remains below the 30-period moving average, and recent attempts to break higher have stalled near 110.33, keeping the broader tone cautious.
A confirmed break above the 110.40–110.50 zone may signal renewed buying, while failure to hold above 110.03 exposes the chart to further weakness.
Markets are now watching for next week’s economic indicators, including industrial production, retail sales, and Fed speeches, for further insight into whether the bond market panic has peaked—or is just beginning.


