Key Points
- USDX closed at 108.996, up 0.66% for the session and 1.1% for the week.
- Fewer expected Fed rate cuts and U.S. economic strength fuel the dollar’s rally.
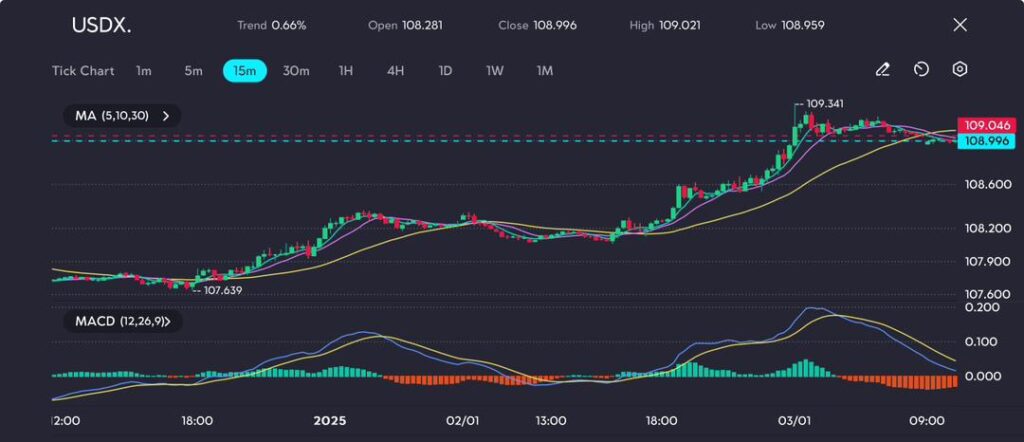
The U.S. Dollar Index (USDX) maintained its strong momentum on Friday, closing at 108.996, just below its intraday high of 109.021.

Picture: USDX tests 109.00 resistance with traders eyeing US economic data for further direction, as seen on the VT Markets app.
Looking at the chart, the US Dollar Index (USDX) tested resistance at 109.00 after opening at 108.281. The 15-minute chart shows upward-sloping moving averages, indicating sustained bullish momentum, although the MACD histogram suggests fading strength as the price consolidates near the session high of 109.021.
Immediate support is visible near 108.60, while a breakout above 109.00 could open room for further gains. The index reflects cautious optimism amid positive US economic data and early-year thin trading conditions.
See also: US Dollar Climbs Near Two-Year High
The dollar is on track for its best weekly performance in over a month, buoyed by expectations of limited Federal Reserve rate cuts and the ongoing resilience of the U.S. economy.
The Federal Reserve’s cautious approach to rate cuts in 2025 underpinned the dollar’s strength, with markets pricing in only 44 basis points of easing this year.
This contrasts sharply with expectations of 100 bps of cuts by the European Central Bank (ECB) and 60 bps by the Bank of England, widening the rate differential in favour of the dollar.
The U.S. economy’s consistent outperformance relative to global peers has also supported the greenback.
Policy Uncertainty Add Safe-Haven Demand
The dollar continues to see boosts from safe-haven flows ahead of President-elect Donald Trump’s January 20 inauguration.
Markets remain cautious about potential trade tariffs, tax reforms, and immigration restrictions under the incoming administration. This policy uncertainty has enhanced the greenback’s appeal, strengthening its already enduring position.


