


Key Points:
- Offshore yuan (USDCNH) plunges to a new low of 7.4288 per dollar.
- Recovery seen as USDCNH rises to 7.38333 after hitting 7.3361 earlier.
- Chinese state banks intervene, selling dollars to stabilise the currency.
- Escalating U.S.-China trade war, U.S. tariffs push yuan down.
Offshore Yuan Reaches Record Low Amid Escalating Trade War
The offshore yuan (USDCNH) hit a new low on 09 April at 7.4288 per dollar, as escalating trade tensions between the U.S. and China intensified market uncertainty. Following the drop, the offshore yuan bounced slightly, recovering by 0.62% to 7.38333 in the Asian session.
This sharp depreciation of the yuan occurred amidst escalating trade conflict, following the U.S. imposition of a 104% tariff on Chinese imports, causing investors to reassess the currency’s stability.
Intervention by Chinese State Banks
In response to the rapid decline of the offshore yuan, Chinese state-owned banks were seen selling dollars in the market to curb the yuan’s fall. Additionally, the People’s Bank of China (PBoC) set the midpoint rate for the onshore yuan (USDCNY) at 7.2066, the weakest level since September 2023. This intervention aims to prevent further depreciation and stabilize the market.
The People’s Bank of China (PBoC) continues to play an active role in moderating the pace of the yuan’s decline. While a weaker yuan could help China’s exports, prolonged depreciation could lead to capital outflows and jeopardize financial stability.
Technical Outlook for Offshore Yuan
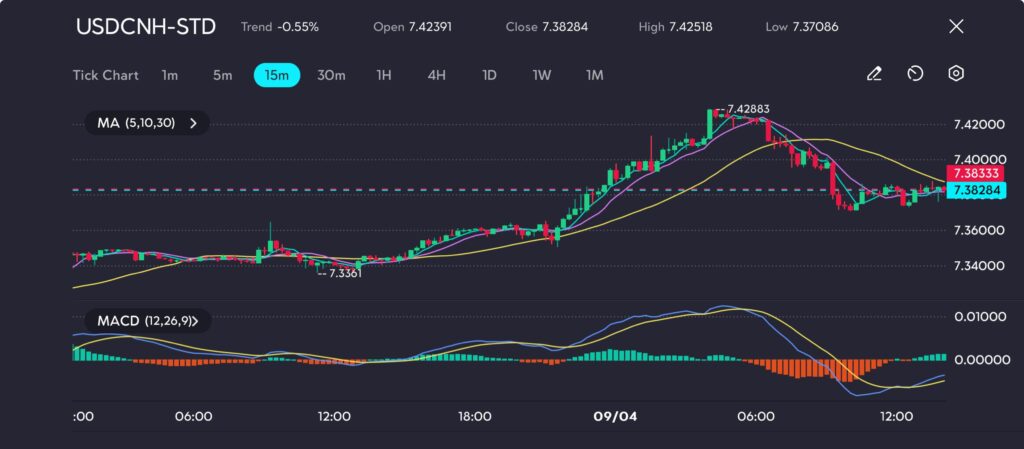
Picture: USDCNH retraces from resistance at 7.42883, testing support at 7.3361, as seen on the VT Markets app.
USDCNH decreased by 0.55%, closing at 7.38284 after opening at 7.42391. The pair initially moved higher, reaching a peak of 7.42883 before retracing and closing at 7.38284.
The moving averages (MA 5,10,30) suggest a bearish shift, as the shorter-term moving averages are starting to cross below the longer-term ones, indicating downward pressure. The MACD (12,26,9) further confirms this trend, showing a negative histogram as the MACD line (blue) moves below the signal line (yellow).
Key levels to monitor include 7.42883 as immediate resistance and 7.3361 as support. A break below support could suggest further declines, while a recovery above resistance could signal a possible reversal. Watch for developments in the broader market for further confirmation of this trend.
As the trade conflict between the U.S. and China remains unresolved, the offshore yuan continues to face volatility. Analysts will closely monitor any developments in trade talks and interventions by the PBoC to gauge the next movements of the currency.


