


Key Points:
- USDJPY falls sharply, hitting a low of 142.318 during the session.
- Japanese yen strengthens, reaching its highest level since September 2024.
- Escalating U.S.-China trade war causes broad dollar weakness, boosting demand for safe-haven assets like the yen while U.S. Treasury selloff bolsters yen gains.
USDJPY Slides Amid Rising Tensions
The USDJPY currency pair saw a significant drop on Friday, sliding to a low of 142.318, the weakest level seen since September 2024. This sharp decline was driven by growing U.S.-China trade tensions, as President Trump’s aggressive tariff policies caused widespread dollar weakness. As market participants sought the yen as a safe-haven asset, the Japanese currency surged.
The U.S. dollar faced further pressure as Treasury yields dropped, reinforcing the yen’s rise. U.S. Treasury selloffs, typically considered a hedge against economic uncertainty, have led to increased demand for the Japanese yen, further pushing USDJPY lower.
Escalating U.S.-China Trade War Pushes the Yen Higher
The escalating U.S.-China trade war continued to weigh heavily on market sentiment. China’s imposition of a 125% tariff on U.S. goods sparked fears of a global recession. Beijing’s firm stance against U.S. tariff actions added to concerns of a prolonged trade conflict, which would likely slow global growth and reduce demand for U.S. dollars.
In addition to the U.S.-China tensions, U.S.-Japan trade negotiations remained in focus. Japan has been seeking to secure more favorable trade terms in ongoing talks, with 10% tariffs currently in place on some goods. The outcome of these negotiations could further impact USDJPY.
Technical Outlook for the Ninja
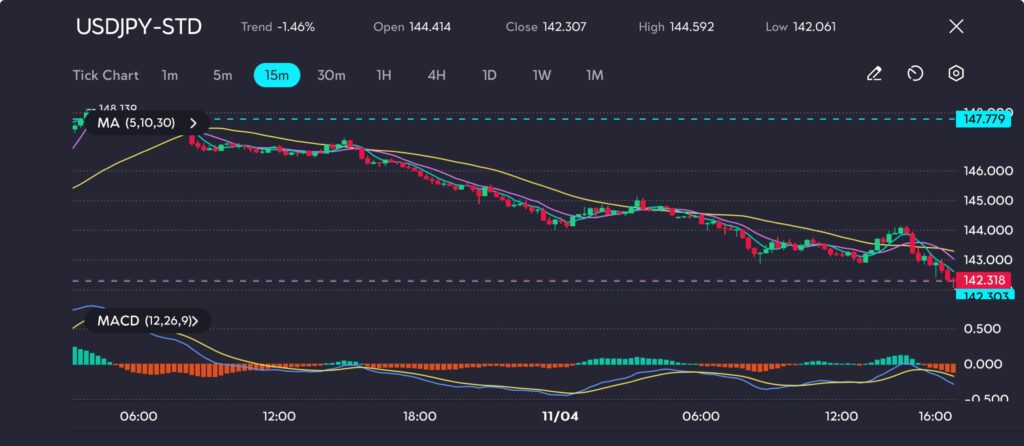
Picture: USDJPY slides to 142.307, testing support after bearish momentum, as seen on the VT Markets app.
USDJPY decreased by 1.46%, closing at 142.307 after opening at 144.414. The pair saw a consistent downward movement, reaching a low of 142.061 before closing near 142.307.
The moving averages (MA 5,10,30) show a bearish trend, with the shorter-term moving averages crossing below the longer-term ones. This indicates continued downward momentum. The MACD (12,26,9) confirms the bearish trend, with the MACD line (blue) remaining below the signal line (yellow) and the histogram staying in negative territory.
Key levels to watch include 142.318 as immediate support and 147.779 as resistance. A break below support could signal further downside potential, while a rise above resistance could suggest a trend reversal.
The USDJPY is likely to continue its downward trend if the U.S.-China trade war continues to escalate. The yen’s safe-haven demand will likely remain strong, especially as U.S. Treasuries continue to lose appeal. Geopolitical tensions and ongoing trade negotiations will play a key role in determining the future direction of USDJPY.


