US stocks slid on Thursday and erased gains on speculation the rally that followed softer inflation data went too far, with Federal Reserve still setting monetary policy tight. A key measure of US producer prices unexpectedly fell for the first time in more than two years, mainly reflecting a drop in energy costs. A similar result to the consumer prices report on Wednesday, both the overall and core figures were softer than forecast. However, inflation remains stubbornly high and will likely keep the Fed on a hawkish path to curb it. Meanwhile, equities have been bolstered by a better-than-expected earnings season, and those companies that have trailed analysts’ estimates were rewarded with the biggest gains in at least five years.

The benchmarks, S&P500 and Dow Jones Average Industrial were both little changed down on Thursday after the market consumed CPI numbers. Five out of eleven sectors stayed in positive territory, as Energy and Financial sectors performed best among all groups, rising 3.19% and 1.02% respectively. It’s worth noting that big Tech underperformed as Nasdaq 100 more than 20% above its June lows, and the index slid 0.6% on daily basis for the day.

Main Pairs Movement
US dollar was slightly lower on Thursday, following a dramatic 1% loss the previous day when data showed U.S. inflation was not as hot as anticipated in July. The DXY index edged lower since the Asia trading session and touched a daily-low level below 104.6, and then rebounded to a level above 105.2.
The GBP/USD slid with a 0.11 % loss on daily basis, as the market amid a risk-off impulse while the greenback weakened. The cables witnessed fresh upbeat transactions during the Asian trading session and then lost bullish momentum and fell to a level below 1.220. Apart from that, investors needed to keep an eye out for the critical GDP report on Friday, to confirm the slowdown of economic growth across the UK. Meantime, EURUSD has turned sideways around 1.032, and the pairs advanced with a 0.2% gain for the day.
Gold declined with a 0.15% loss on daily basis, as Federal officials keep their hawkish stances. XAUUSD oscillate in a range from $1,783 to $1,799 marks. WTI and Brent oil both surged on Thursday, rising 2.62% and 2.13% respectively.
Technical Analysis
EURUSD (4-Hour Chart)

The EUR/USD pair advanced on Thursday, preserving its upside traction and extending its previous rebound toward the 1.036 mark after the release of softer-than-expected US PPI data. The pair is now trading at 1.03281, posting a 0.28% gain daily. EUR/USD stays in the positive territory amid a weaker US dollar across the board, as the easing US inflation figures lend support to market sentiment and kept the safe-haven greenback to remain on the back foot. The US Producer Price Index (PPI) declined to 9.8% every year in July, which came in lower than the market’s expectations and pushed the EUR/USD pair higher. For the Euro, European indexes struggle to post advances and the EUR/USD pair up for the fifth consecutive day.
For the technical aspect, the RSI indicator is 66 as of writing, suggesting that the upside is more favoured as the RSI stays above the mid-line. As for the Bollinger Bands, the price failed to climb higher but hovered around the upper band, therefore some upside traction can be expected. In conclusion, we think the market will be slightly bullish as the pair is testing the 1.0325 resistance line. A sustained strength above that level might open the road to additional gains.
Resistance: 1.0325, 1.0438, 1.0484
Support: 1.0282, 1.0158, 1.0111
GBPUSD (4-Hour Chart)

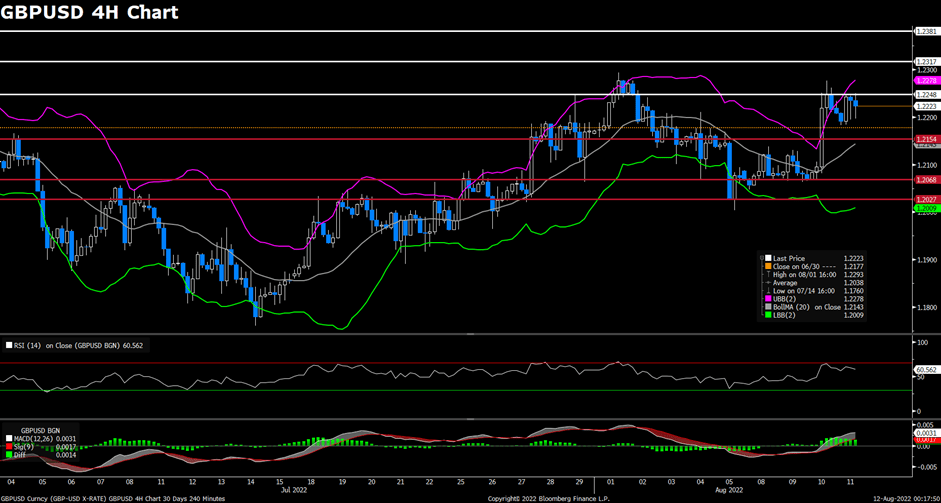
The GBP/USD pair edged higher on Thursday, failing to gather bullish momentum and remaining under pressure below the 1.225 mark during the US session amid risk-off market sentiment. At the time of writing, the cable stays in positive territory with a 0.11% gain for the day. The cooler-than-expected US inflation report and the upbeat US Initial Jobless Claims figure both exerted bearish pressure on the safe-haven greenback and underpinned the GBP/USD pair. The economic data showed that supply-chain conditions are improving and inflationary pressures on the wholesale side have also begun to ease. For the British pound, the Bank of England Chief Economist Huw Pill said on Thursday that higher rates in the short term could also mean some slowing in the UK economy.
For the technical aspect, the RSI indicator is 61 as of writing, suggesting that sellers remain on the sidelines as the RSI on the four-hour chart stays near 60. For the Bollinger Bands, the price failed to preserve upside traction and started to retreat, therefore a continuation of the downside trend can be expected. In conclusion, we think the market will be bearish as long as the 1.2248 resistance line holds. On the upside, if the pair climbs above that level and starts using it as support, bulls could show interest and lift the pair higher.
Resistance: 1.2248, 1.2317, 1.2381
Support: 1.2154, 1.2068, 1.2027
XAUUSD (4-Hour Chart)

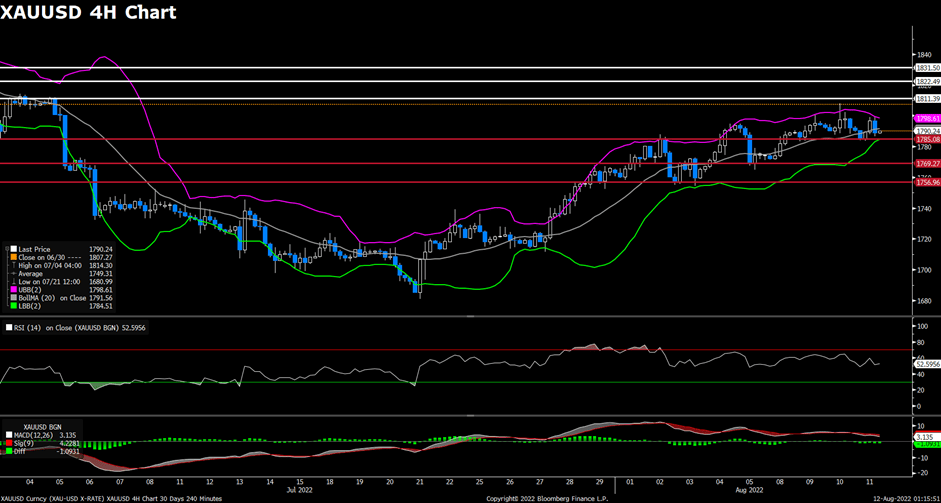
Despite the renewed weakness witnessed in the US dollar amid the softer-than-expected US PPI report on Thursday, the pair XAU/USD struggled to gather bullish momentum and retreated to the $1,787 area to erase most of its daily gains during the US trading session. XAU/USD is trading at 1,789.87 at the time of writing, losing 0.13% daily. Signs that inflation might have peaked already continue to support speculations for a less aggressive policy tightening by the Fed, as the softer-than-expected US PPI data have also reinforced market expectations. For the time being, a 50 bps rate hike by the Fed seems likely in the September meeting. Moreover, the risk-on market mood might keep a lid on any further gains for the safe-haven metal.
For the technical aspect, the RSI indicator is 52 as of writing, suggesting the pair’s indecisiveness in the near term as the RSI indicator stays near the mid-line. For the Bollinger Bands, the price witnessed fresh selling and dropped below the moving average, therefore the downside traction should persist. In conclusion, we think the market will be bearish as the pair is heading to test the 1785 support line. A break below that level could favour the bear skewed the risk to the downside.
Resistance: $1,811, $1,822, $1,831
Support: $1,785, $1,769, $1,756
Economic Data
| Currency | Data | Time (GMT + 8) | Forecast |
| GBP | GDP (YoY) (Q2) | 14:00 | 2.8% |
| GBP | GDP (QoQ) (Q2) | 14:00 | -0.2% |
| GBP | GDP (MoM) | 14:00 | -1.2% |
| GBP | Manufacturing Production (MoM) (Jun) | 14:00 | -1.8% |
| GBP | Monthly GDP 3M/3M Change | 14:00 | -0.3% |