


Since peaking on February 19, 2025, the S&P 500 has fallen 10.43%, a sharp enough move to shake confidence but still technically within the bounds of a classic correction.
This slide in equities has sparked a wave of pessimism across social media and trading circles, amplified by the fact that many individual stocks have fallen between 20% and 40%. The trigger: former President Donald Trump’s tariff proposal, which first set its sights on Canada, Mexico, and China, and then widened its aim toward Europe and other regions.
With full tariff details expected on April 2, the timing has left traders in a lurch, weighing whether this downturn reflects market panic or a deeper recalibration in response to a seismic shift in trade policy. The question is straightforward: has the market already absorbed the tariff threat? Or is this a prelude to a larger, more sustained drop?
On the surface, the data suggests that a bear market isn’t here yet. A bear market, traditionally defined as a decline of more than 20%, tends to carry heavier implications—most notably a recession. Yet, we’re not in those waters. The 10.43% decline is still in line with the average correction range, which usually lands somewhere between 10% and 15%. That context matters. It implies pain, but not panic.
The market is also not flashing recession alarms. One key metric that has accurately forecasted past recessions is the smoothed U.S. Recession Probabilities indicator. It has historically been reliable when readings cross above 10%. The current figure—just 0.26—is far from danger territory. It lends weight to the idea that the current correction is more sentiment-driven than structurally rooted in economic collapse.
Market Movements This Week
Now that we’ve unpacked the macro story—the tariffs, the fear, and the fundamentals—it’s time to zoom in. We’ve been watching the charts carefully this week, and the price action across majors and commodities is giving us a clearer view of where opportunity might show up next. Whether you’re trading intraday moves or looking for swing entries, the zones we’re approaching are worth paying attention to.
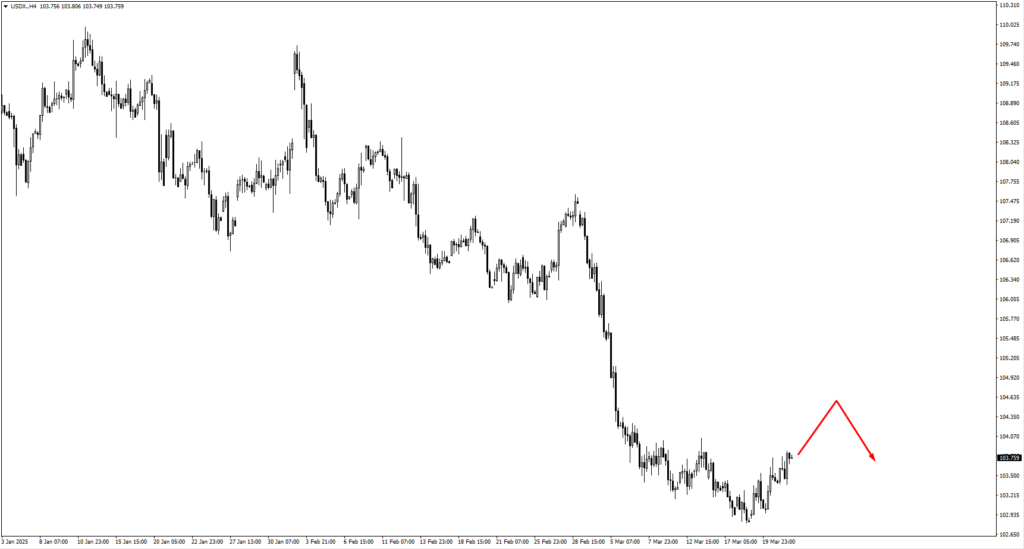
The U.S. Dollar Index (USDX) extended its move higher from the 102.65 region. If momentum holds, we’re eyeing two upper zones for possible reversal patterns—104.90 and 105.60. But if price slips instead, then the 102.20 level will be key to watch for bullish setups.
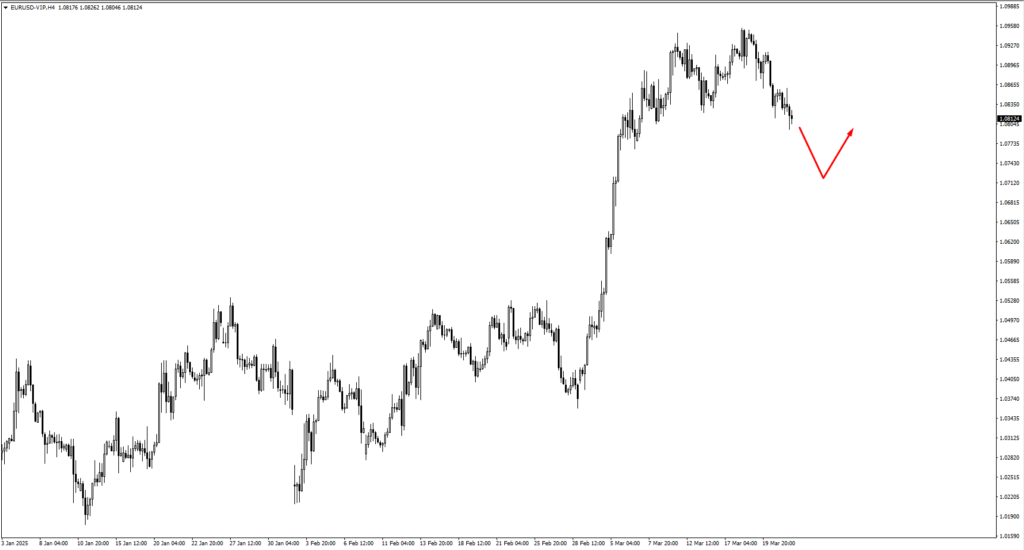
EURUSD has been bleeding lower since testing the 1.0940 zone late last week. If this downward slide continues, the next bullish watch areas are at 1.0695 and 1.0610. Should EURUSD snap back higher, we’ll be paying attention to 1.1030 for bearish signals. It’s still following the dollar’s rhythm.
GBPUSD is tracking a similar path, moving lower from the monitored 1.3030 zone. As price drifts down, our eyes are on 1.2820, 1.2780, and 1.2720 for signs of buying interest. On any retracement upward, 1.3090 becomes a fresh bearish reaction level.
USDJPY closed above the 149.30 level, which could now act as a launchpad for more upside. If price pushes higher, we’ll be watching price action near 150.80 and 152.00 for rejection or continuation.
USDCHF appears to be consolidating around the 0.8840 zone. From here, we could see a move up to 0.8900. But if instead it rolls over and makes a new swing low, we’ll be on alert for bullish setups around 0.8715.
AUDUSD has been grinding lower, and the zones to watch this week for a bounce are 0.6250 and 0.6225. We’ll be judging the type of price action there before committing to any long ideas.
NZDUSD is in a similar situation, with downside pressure pushing it toward 0.5700 and 0.5650—zones where we’ll watch for a reaction.
USDCAD, meanwhile, is stuck in a messy structure. No clean trades yet—price needs to break out of its range before any directional setup becomes clear.
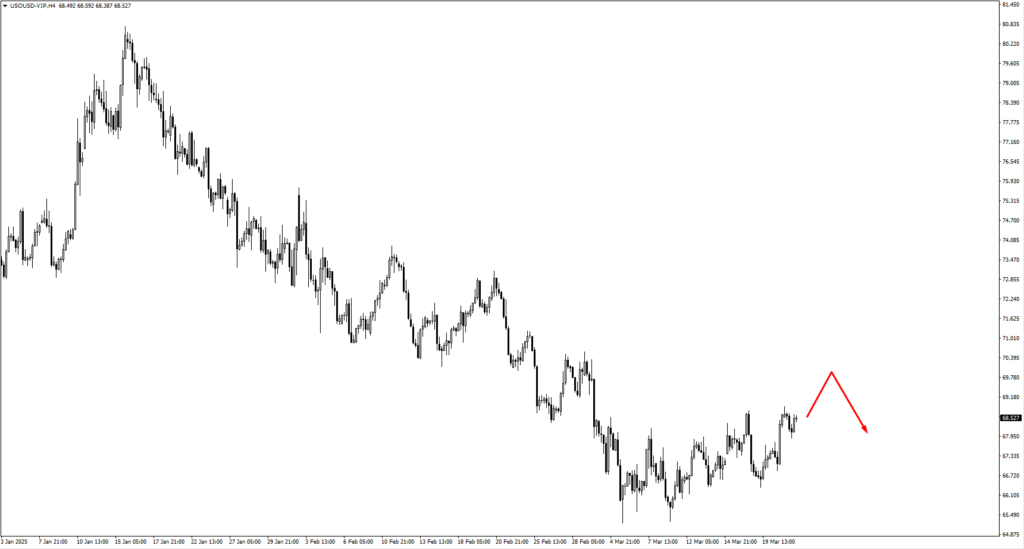
USOil is on watch again this week. If it climbs toward 69.85, we’ll be ready for bearish signals. But there’s a chance it revisits the low at 61.74, which would mark a continuation of the broader downward pressure.
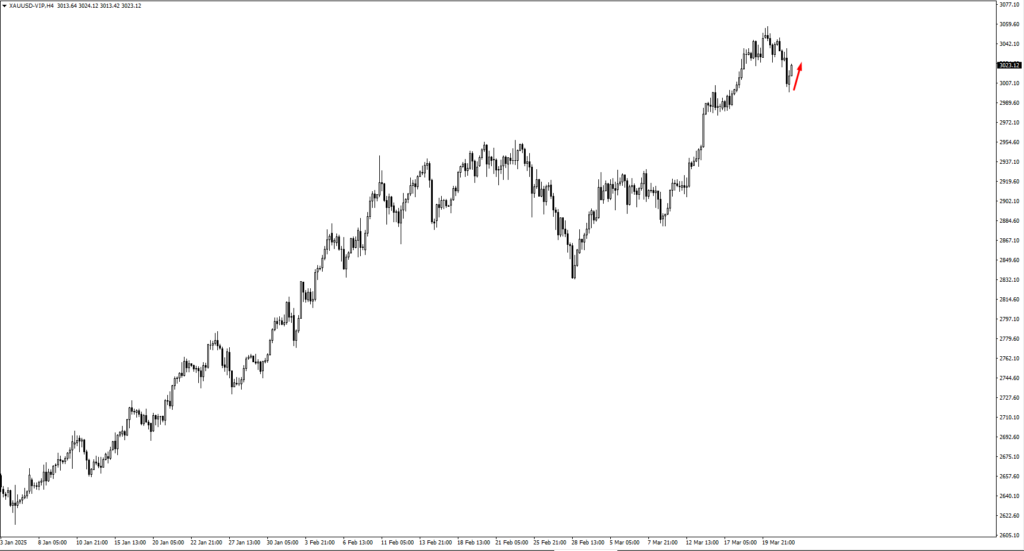
Gold traded lower from the previously monitored 3050 zone before staging a mild recovery. If it tests the 3030 level, we’ll be observing closely. A push up to 3039.50 could mean a new all-time high is coming. Should momentum hold, 3080 is the level where bears may step back in.
The S&P 500, which has been under the microscope due to macro headlines, is also climbing again. If this continues, price action at 5760 and 5830 will be key for determining if the bounce has legs—or if we’re about to roll over again.
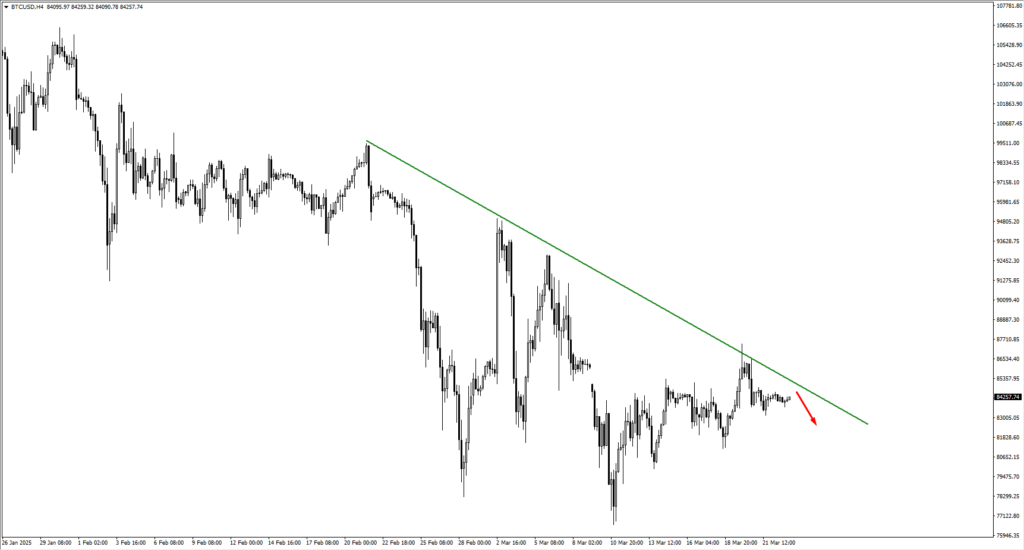
Bitcoin has paused into a consolidation pattern. If it breaks the trendline to the upside, price could retest the 89,150 or 92,300 levels. But if it sweeps the lows first, 74,000 becomes the prime zone to search for bullish activity.
Natural Gas found support at 3.90 last week. If it dips further, we’ll be monitoring 3.70 for renewed buying momentum.
As we move through the week, we’ll continue to track these zones, keeping entries aligned with M15 price action and H1/H4 candlestick confirmations. Until the broader market finds its footing, these technical levels give us the clearest map forward.
Key Events This Week
Monday opens with a string of Flash PMI data that could shape the early-week tone. Germany’s Manufacturing PMI is expected at 47.1 (up from 46.5), while Services is forecasted at 52.3 (vs. 51.1), suggesting slight recovery momentum. The UK shows similar trends, with Manufacturing at 47.3 and Services at 51.2, both just above last month’s prints. These small upticks could give EURUSD and GBPUSD some room to bounce if prices dip into early support zones.
In the U.S., the PMI picture is mixed. Manufacturing is forecasted to fall to 51.9 from 52.7, while Services ticks up slightly to 51.2 from 51.0. If risk sentiment improves, that split could nudge the dollar lower and pressure USDX midweek.
Tuesday brings Bank of England Governor Andrew Bailey to the stage. Markets will be listening closely, especially with growing chatter around a 25bps rate cut possibly coming in May. Any shift in tone or hint of dovishness could weigh further on the pound—especially if Monday’s PMI data disappoints.
On Wednesday, it’s all eyes on inflation data out of Australia and the UK. Australia’s CPI y/y holds steady at 2.50%, while the UK’s is forecasted at 2.90%, just below last month’s 3.00%. With central banks still balancing between growth and price stability, even small deviations in these numbers could trigger sharp moves. Referencing structure at the time will be essential when interpreting how the market responds.
Thursday delivers U.S. Final GDP q/q data. The consensus is for 2.40%, a slight uptick from the prior 2.30%. If confirmed, that would help reinforce the idea that Q1 isn’t falling off a cliff—especially after adjusting for the recent gold import distortions.
Friday wraps up the week with Canada’s GDP m/m and the U.S. Core PCE Price Index m/m. Canada’s last print was 0.2%, while the U.S. Core PCE, a key inflation metric for the Fed, is expected to hold steady at 0.30%. These releases could be the deciding factor for how markets close out the week—especially if there are any surprises that shift the Fed rate path narrative.
As always, we’ll stay anchored to the zones, reacting only when price confirms. But these events may shake things up, especially as April 2 draws closer. For now, this week is about patience, watching the data, and staying sharp when price meets structure.


